Maths IGCSE E3.22 Graphs of quadratic functions
£3.50
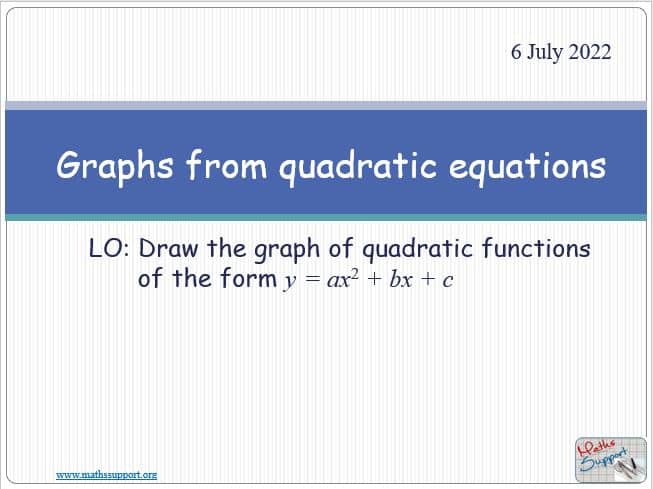
Graphs of quadratic functions – Maths IGCSE Extended
Maths Power point presentation with 16 slides explaining how to draw the graph of quadratic functions of the form y = ax² + bx + c
You will get a PPTX file
PPTX files
Be sure that you have an application to open this file type before purchasing.
Preview
Related products
-
Maths KS3 – 1.04.1 Divide in a given ratio
£3.50Divide in a given ratio – Maths KS3 Power Point presentation, 13 slides, Explaining with examples how to solve simple problems about ratio and proportion using […]
-
Maths KS3 – 2.05.1 Functions and mapping
£3.50Functions and mapping – Maths KS3 Power Point presentation, 11 slides, Explaining with examples how express simple functions algebraically and represent them in mapping diagrams, based […]
-
Maths KS3 – 2.04.1 Solving quadratic equations by trial and improvement
£3.50Solving quadratic equations by trial and improvement – Maths KS3 Power Point presentation, 6 slides, Explaining with examples how to solve simple quadratic equations using the […]


Reviews
There are no reviews yet.