Maths IGCSE E11.33 Scatter diagrams
£3.50
Scatter diagrams – Maths IGCSE Extended
Power Point presentation, 19 slides, Explaining with examples how to draw and use scatter diagrams to compare and determine the relationship between two variables., based on the IGCSE International Maths 0607 Syllabus.
You will get a PPTX file
PPTX files
Be sure that you have an application to open this file type before purchasing.
Preview
Related products
-
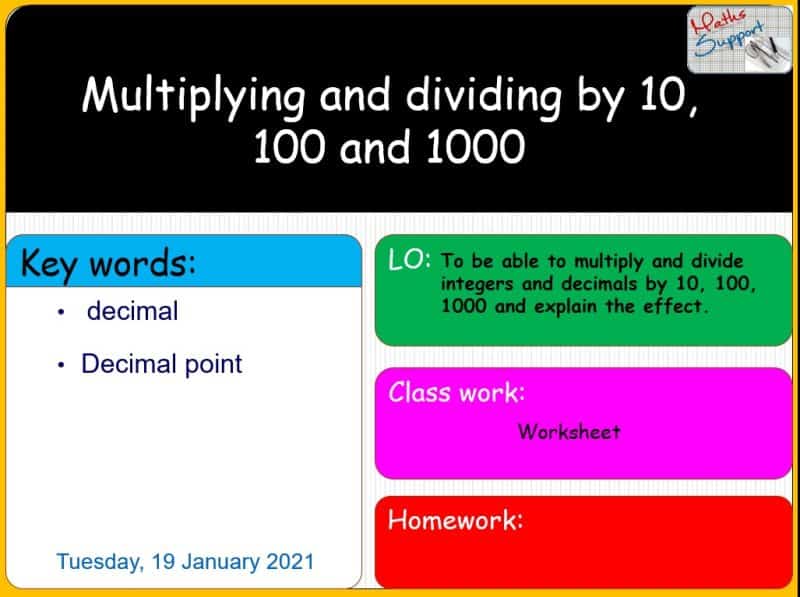
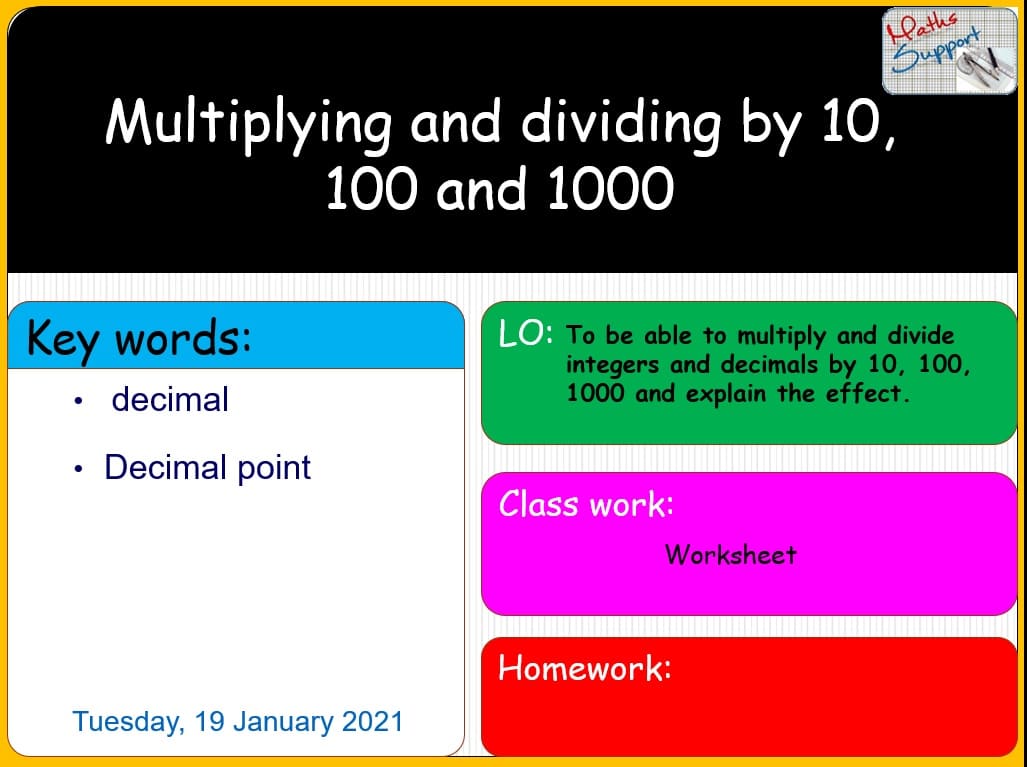
Maths KS3 – 1.02.3 Multiplying and dividing by 10, 100, 1000
£3.50Multiplying and dividing by 10, 100 and 1000 – Maths KS3 Power Point presentation, 15 slides, Explaining how to multiply and divide any number by 10, […]
-
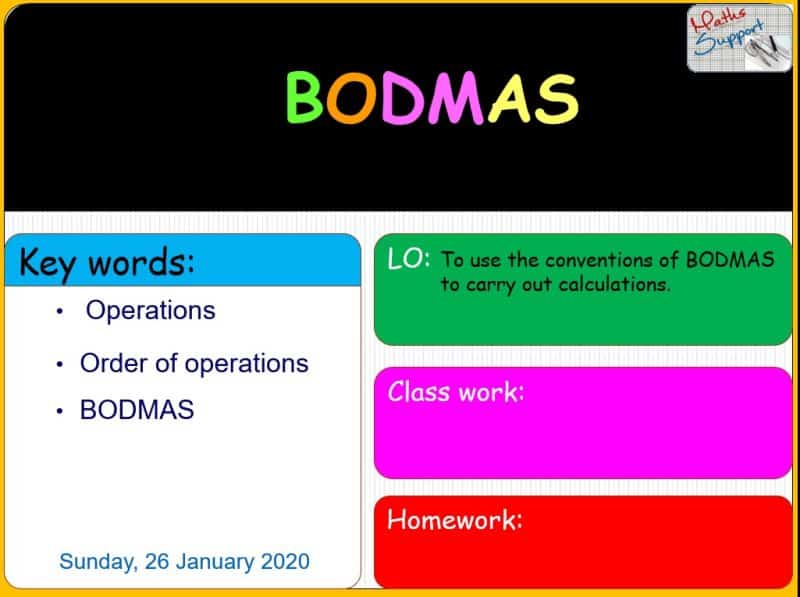
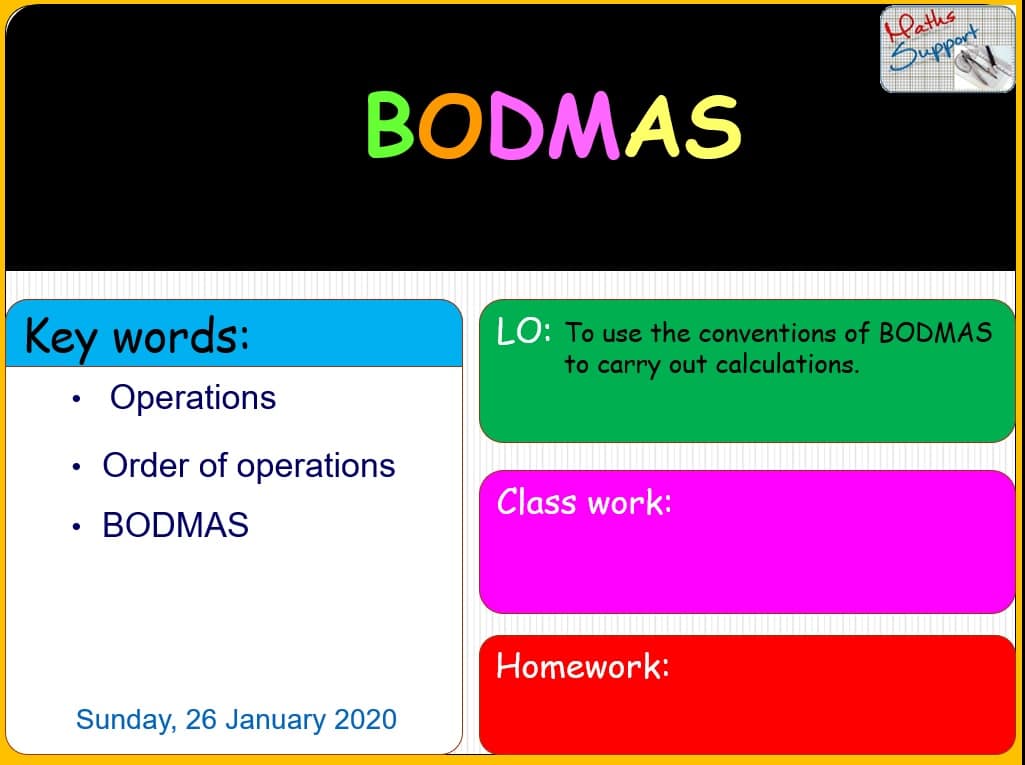
Maths KS3 – 1.02.1 Order of operations (BODMAS)
£3.50Order of operations (BODMAS) – Maths KS3 Power Point presentation, 12slides, Explaining the Order in which the operations are carried out to get the correct answer, […]
-
Maths KS3 – 2.05.1 Functions and mapping
£3.50Functions and mapping – Maths KS3 Power Point presentation, 11 slides, Explaining with examples how express simple functions algebraically and represent them in mapping diagrams, based […]