Maths IBAI – 2.31 The graph of a function
£5.00
The graph of a function – Maths IBAI – SL
Two Power Point presentations, one presentation, 12 slides, using the GDC Casio, and the second presentation 12 slides using the TI GDC, both explaining how to use a GDC to draw the graph of a function and determine the key features of the graph, based on the Maths IB Applications and interpretation syllabus.
Be sure that you have an application to open this file type before purchasing.
Preview
Related products
-
Maths KS3 – 1.02.1 Order of operations (BODMAS)
£3.50Order of operations (BODMAS) – Maths KS3 Power Point presentation, 12slides, Explaining the Order in which the operations are carried out to get the correct answer, […]
-
Maths KS3 – 1.02.4 Methods of division.
£4.00Methods of division – Maths KS3 Power Point presentation, 11 slides, Explaining how to divide using the following methods: Long division, Chunking method, Grid method, and […]
-
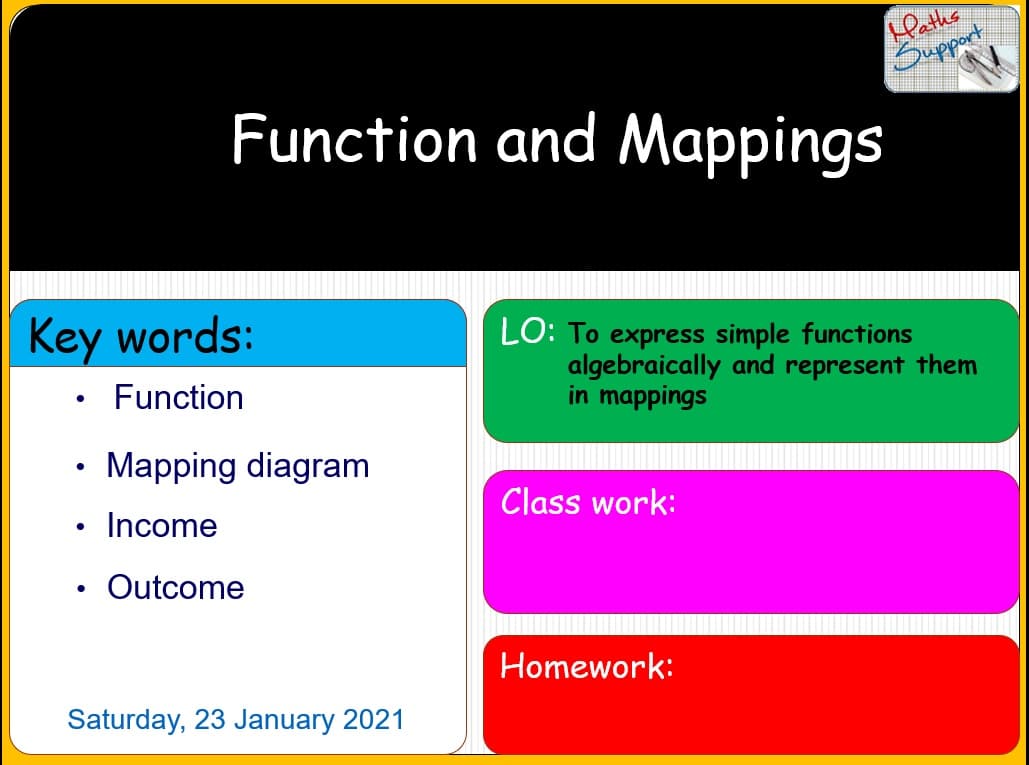
Maths KS3 – 2.05.1 Functions and mapping
£3.50Functions and mapping – Maths KS3 Power Point presentation, 11 slides, Explaining with examples how express simple functions algebraically and represent them in mapping diagrams, based […]