Maths IGCSE 4.61 Graphing from a table of values
£3.50
Description
Graphing from a table of values – Maths IGCSE Core
Maths Power Point presentation, 10 slides, Explaining with examples how to use a table of values to calculate the coordinates of the points to draw a graph, based on IGCSE Syllabus.
Preview
Preview
Reviews 0
Related products
-
Maths KS3 – 1.03.1 Prime factors
£3.50Prime factors – Maths KS3 Power Point presentation, 12 slides, Explaining what prime factors are and how to find the prime factors of any number using […]
-
Maths IGCSE E2.72 Expanding the difference of two squares
£3.50Expanding the difference of two squares – Maths IGCSE Extended Power Point presentation, 11 slides, Explaining with examples how to expand brackets that end up with […]
-
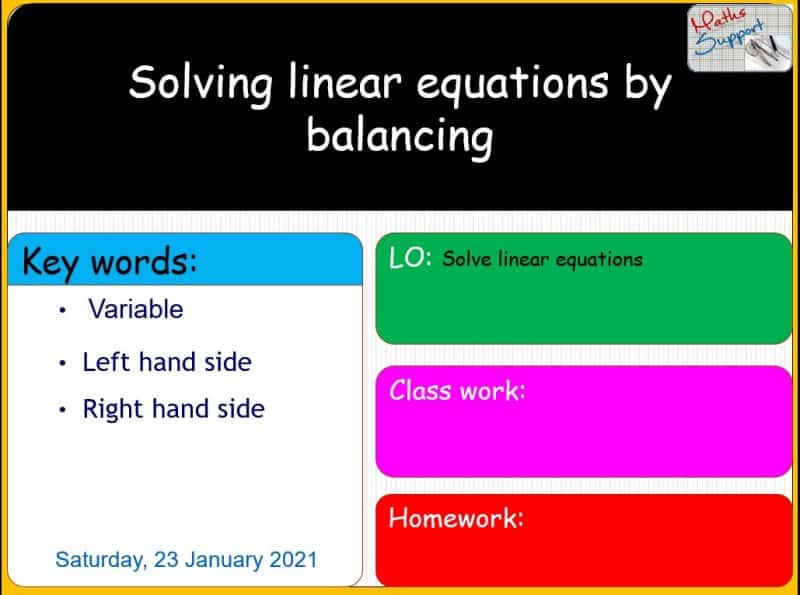
Maths KS3 – 2.03.1 Solving linear equations by balancing
£3.50Solving linear equations by balancing – Maths KS3 Power Point presentation, 14 slides, Explaining with examples how to solve simple linear equations using the balancing method, […]


Reviews
There are no reviews yet.