Maths KS3 – 4.04.0 Scatter graphs and correlation
£3.50
Description
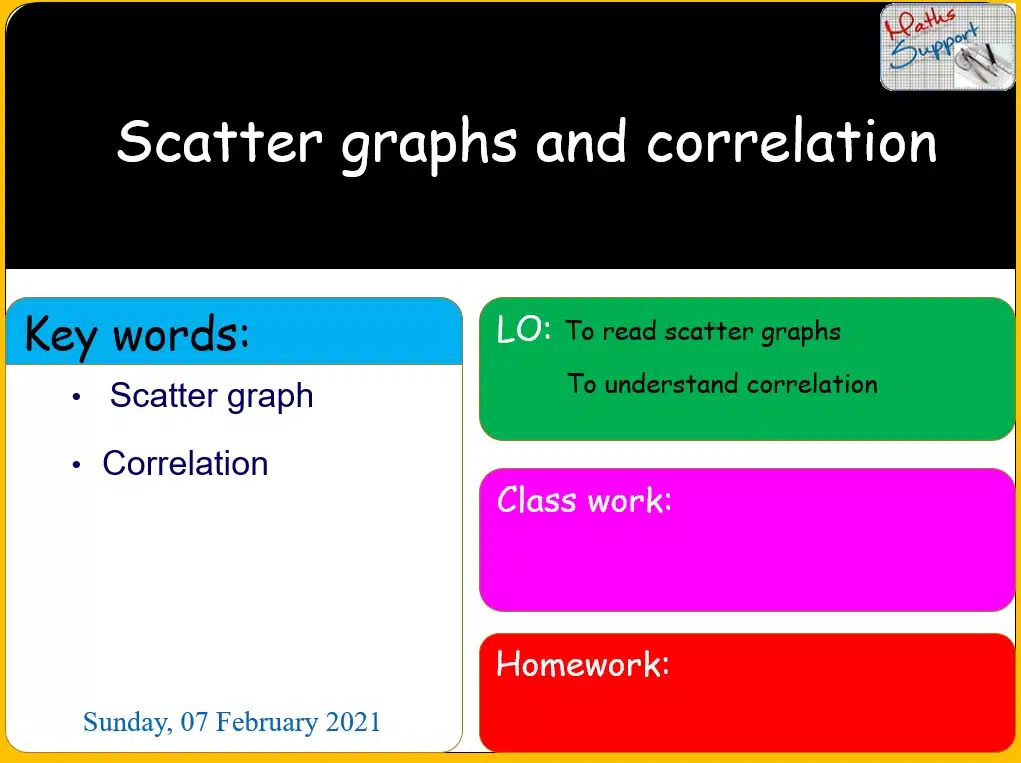
Scatter graphs and correlation – Maths KS3
Power Point presentation, 7 slides, Explaining with examples what correlation is, and how to describe the correlation between the variables, based on the Maths KS3 National curriculum.
Preview
Preview
Reviews 0
Related products
-
Maths IBAA – 5.061.1 The derivative of ln x
£4.00The derivative of ln x – Maths IBAA – SL Power Point presentation, 15 slides, explaining how to find the derivative of functions involving ln x, […]
-
Maths IGCSE E2.72 Expanding the difference of two squares
£3.50Expanding the difference of two squares – Maths IGCSE Extended Power Point presentation, 11 slides, Explaining with examples how to expand brackets that end up with […]
-
Maths IGCSE E1.08.3 Reverse percentage problems
£3.50Reverse percentage problems – Maths IGCSE Extended Power Point presentation, 7 slides, Explaining with examples and real life problems how to calculate the original amount given […]


Reviews
There are no reviews yet.