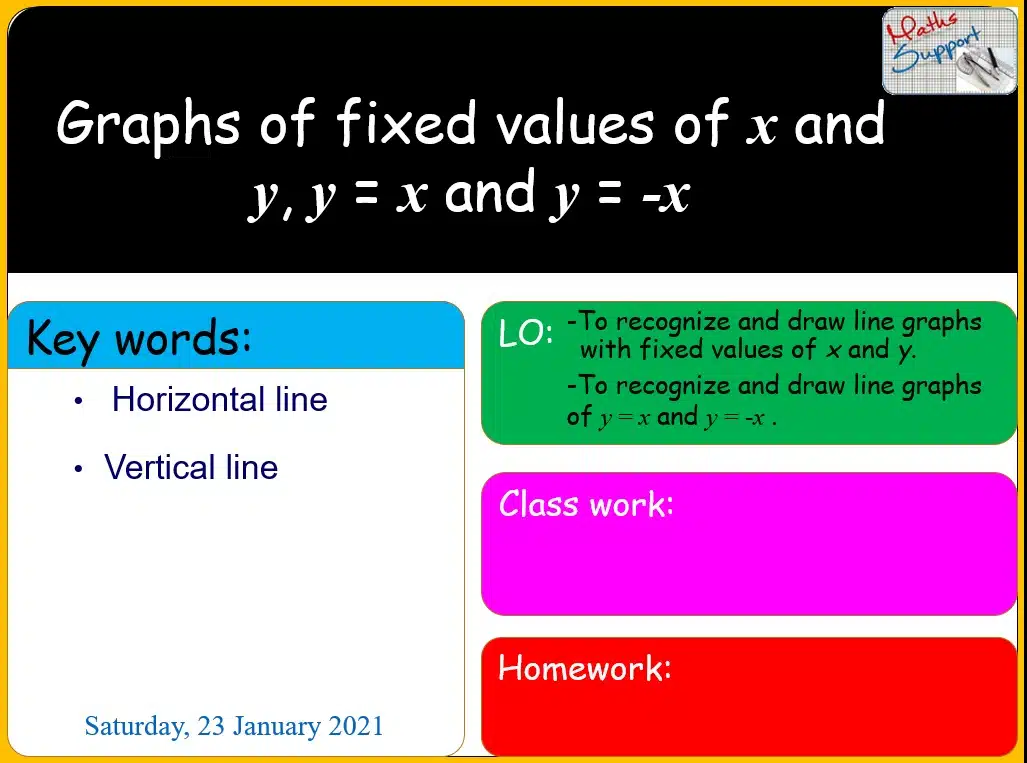
Maths KS3 – 2.06.0 Graphs of fixed values of x or y
£3.50
Description
KS3 – Graphs of fixed values of x or y – Maths KS3
Power Point presentation, 8 slides, Explaining with examples how to recognize and draw line graphs with fixed values of x and y; and to recognize and draw line graphs of y = x and y = -x ; based on KS3 Maths National curriculum.
Preview
Preview
Reviews 0
Related products
-
Maths IGCSE E2.71 The product (a + b)(c + d)
£3.50The product (a + b)(c + d) – Maths IGCSE Extended Power Point presentation, 11 slides, Explaining with examples how to expand two brackets. Use of […]
-
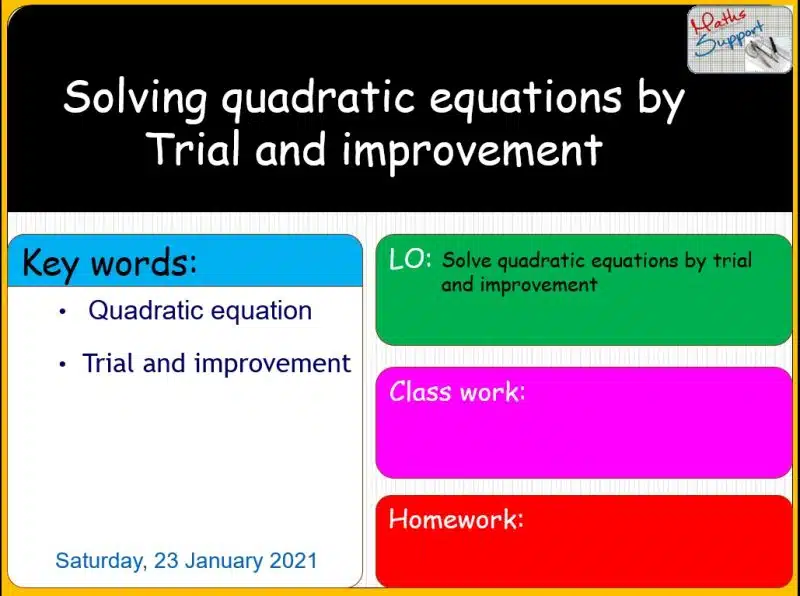
Maths KS3 – 2.04.1 Solving quadratic equations by trial and improvement
£3.50Solving quadratic equations by trial and improvement – Maths KS3 Power Point presentation, 6 slides, Explaining with examples how to solve simple quadratic equations using the […]
-
Maths KS3 – 1.02.3 Multiplying and dividing by 10, 100, 1000
£3.50Multiplying and dividing by 10, 100 and 1000 – Maths KS3 Power Point presentation, 15 slides, Explaining how to multiply and divide any number by 10, […]


Reviews
There are no reviews yet.